Tom August from UKCEH describes how he and his hackathon teammates used network analyses to unpick gender variation in natural history collectors
Naturalists have been exploring and recording the natural world for hundreds of years. They often do this in groups. Understanding these networks of co-collecting was the focus of a hackathon project at BioHackathon Europe 2021 – Barcelona. We explored how these networks changed over time and what role has gender played in shaping these networks.
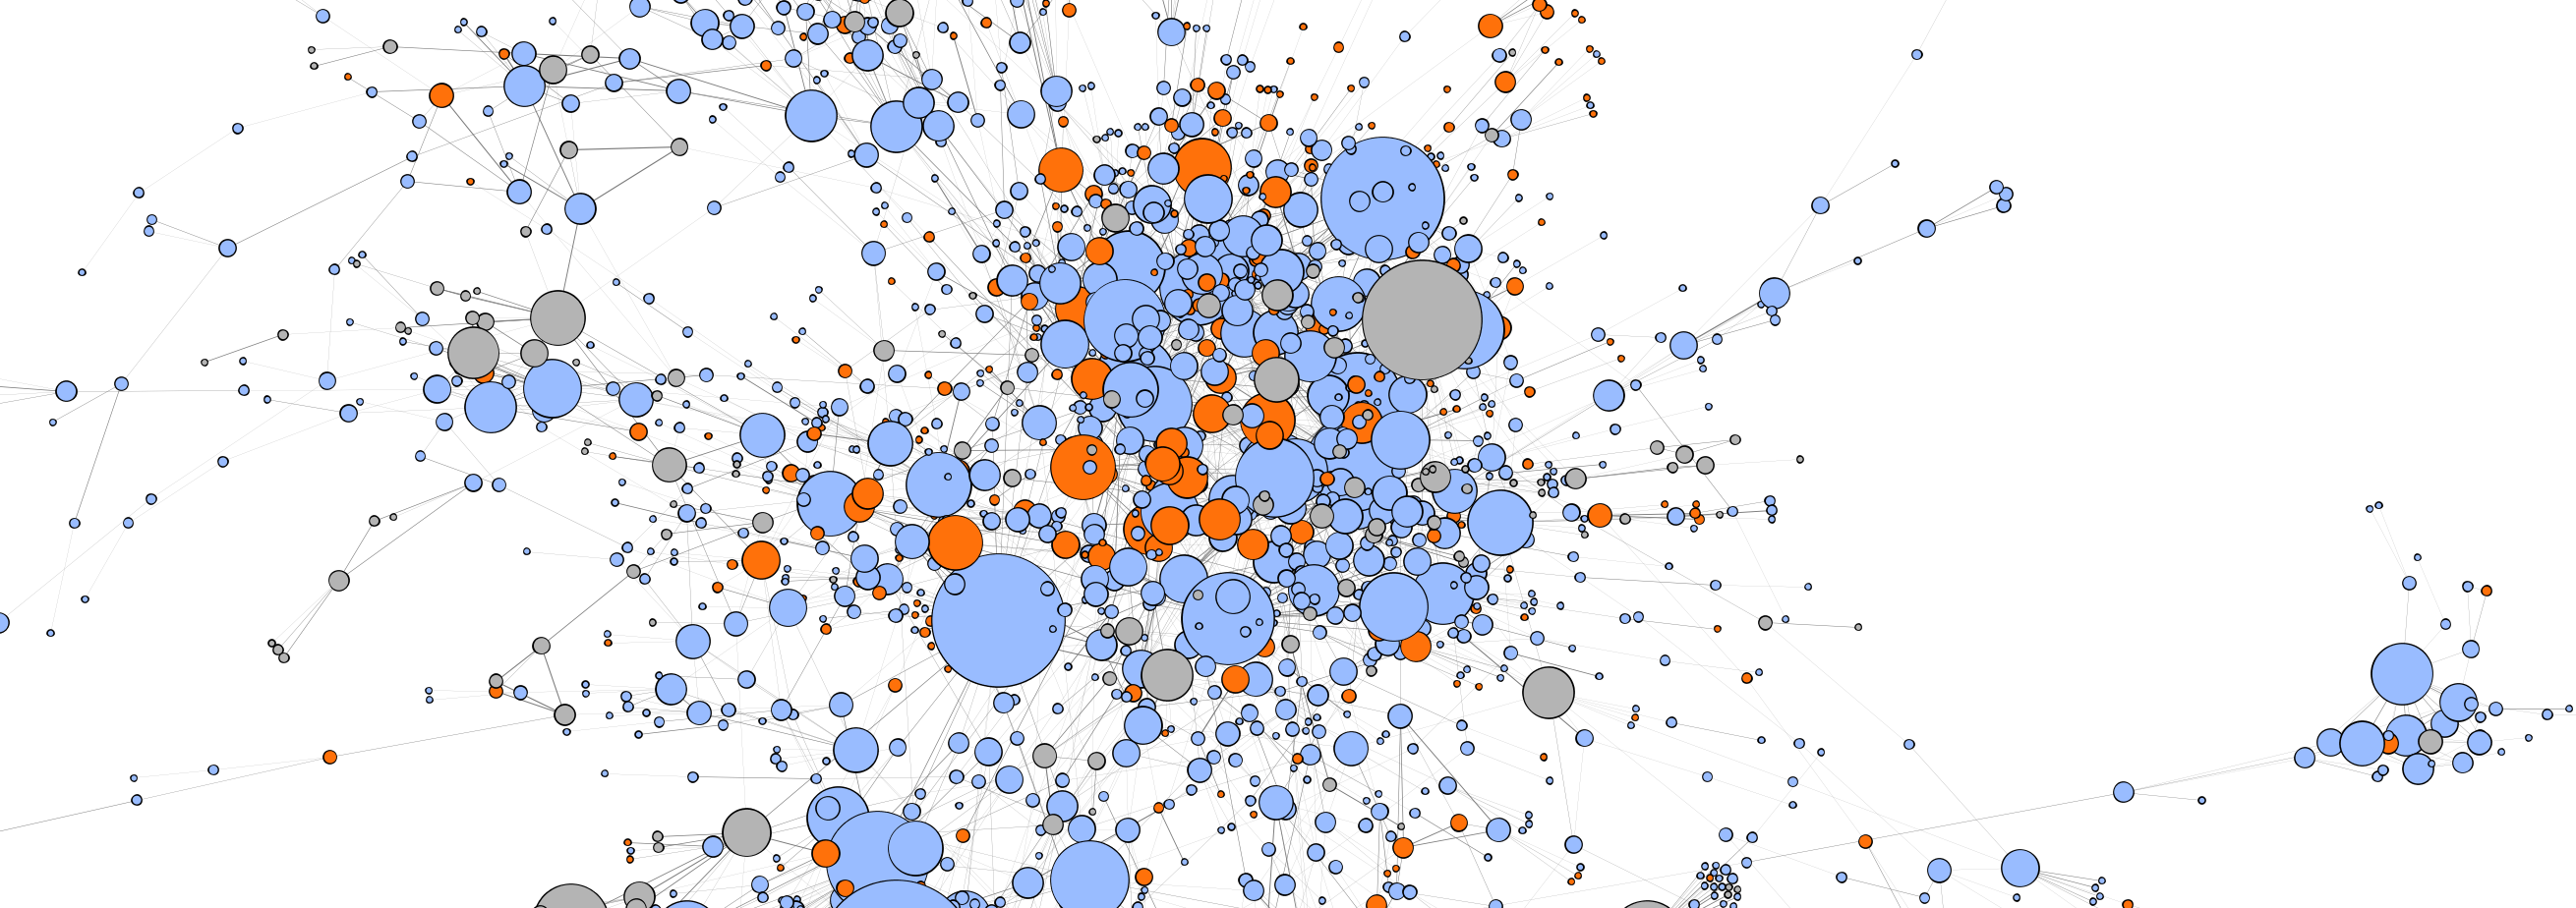
We used data from Bionomia, a database that connects natural history specimens to the people who collected them. Through this database we were able to identify people who co-collected specimens. Digitisation efforts in museums around the world have meticulously transcribed information from specimen labels. These labels record the person or people who collected the specimen. Using these data we created the graph below, showing people (dots) and those they have collected with (lines joining dots).

These graphs were created in Gephi, a nice bit of software for analysing and visualising networks of many kinds. This network of over 3000 people and 4000 connections has been clustered into groups, where individuals within the coloured groups are more connected to each other than individuals from other groups.
We were able to pull in additional data about the collectors from Wikidata, which supplied information including the gender of the collector in many cases. First it is clear that co-collecting has increased over time, which is no surprise since recording is known to have increased over time significantly. Perhaps more interesting is that early co-collecting up until the late 1700s was exclusively between men. In recent times, however, the proportion of co-collecting teams that are male-male are declining, with an increase in male-female and female-female teams.

Understanding these co-collecting networks is valuable. Knowing what ‘normal’ looks like can help us to identify potential errors in the datasets. For example we identified co-collectors who were born many years apart and therefore unlikely to collect together. Understanding these networks also allows us to understand changes in the culture of collecting which in turn shapes the data that is collected. These changes over time are important to understand for those analysing these data.
It’s certainly fun to explore the data that describes these naturalists, but it’s also important not to forget that each of these people are more than data, and have their own story to tell. Our team explored this idea further by creating visualisations (using Affinity designer) that tell the story of three inspiring women in our network analysis, who achieved amazing things in a traditionally male dominated field.


All the data and code that were used in this hackathon are available on our GitHub repository.
This work was a team effort including Sofie Meeus, Tom August, Lien Reyserhove, Maarten Trekels, and Quentin Groom
