COVID-19 Hackathons – Winners announced for third and fourth events

We are pleased to be able to announce the winning teams for the final two events in the NERC COVID-19 Digital Sprint Hackathons – Ecosystem Services and Visualising Risk. We had some really fantastic entries to choose amongst and the judging panels had a hard job. But after much deliberation, the winners to date are […]
Data Visualisation Tools

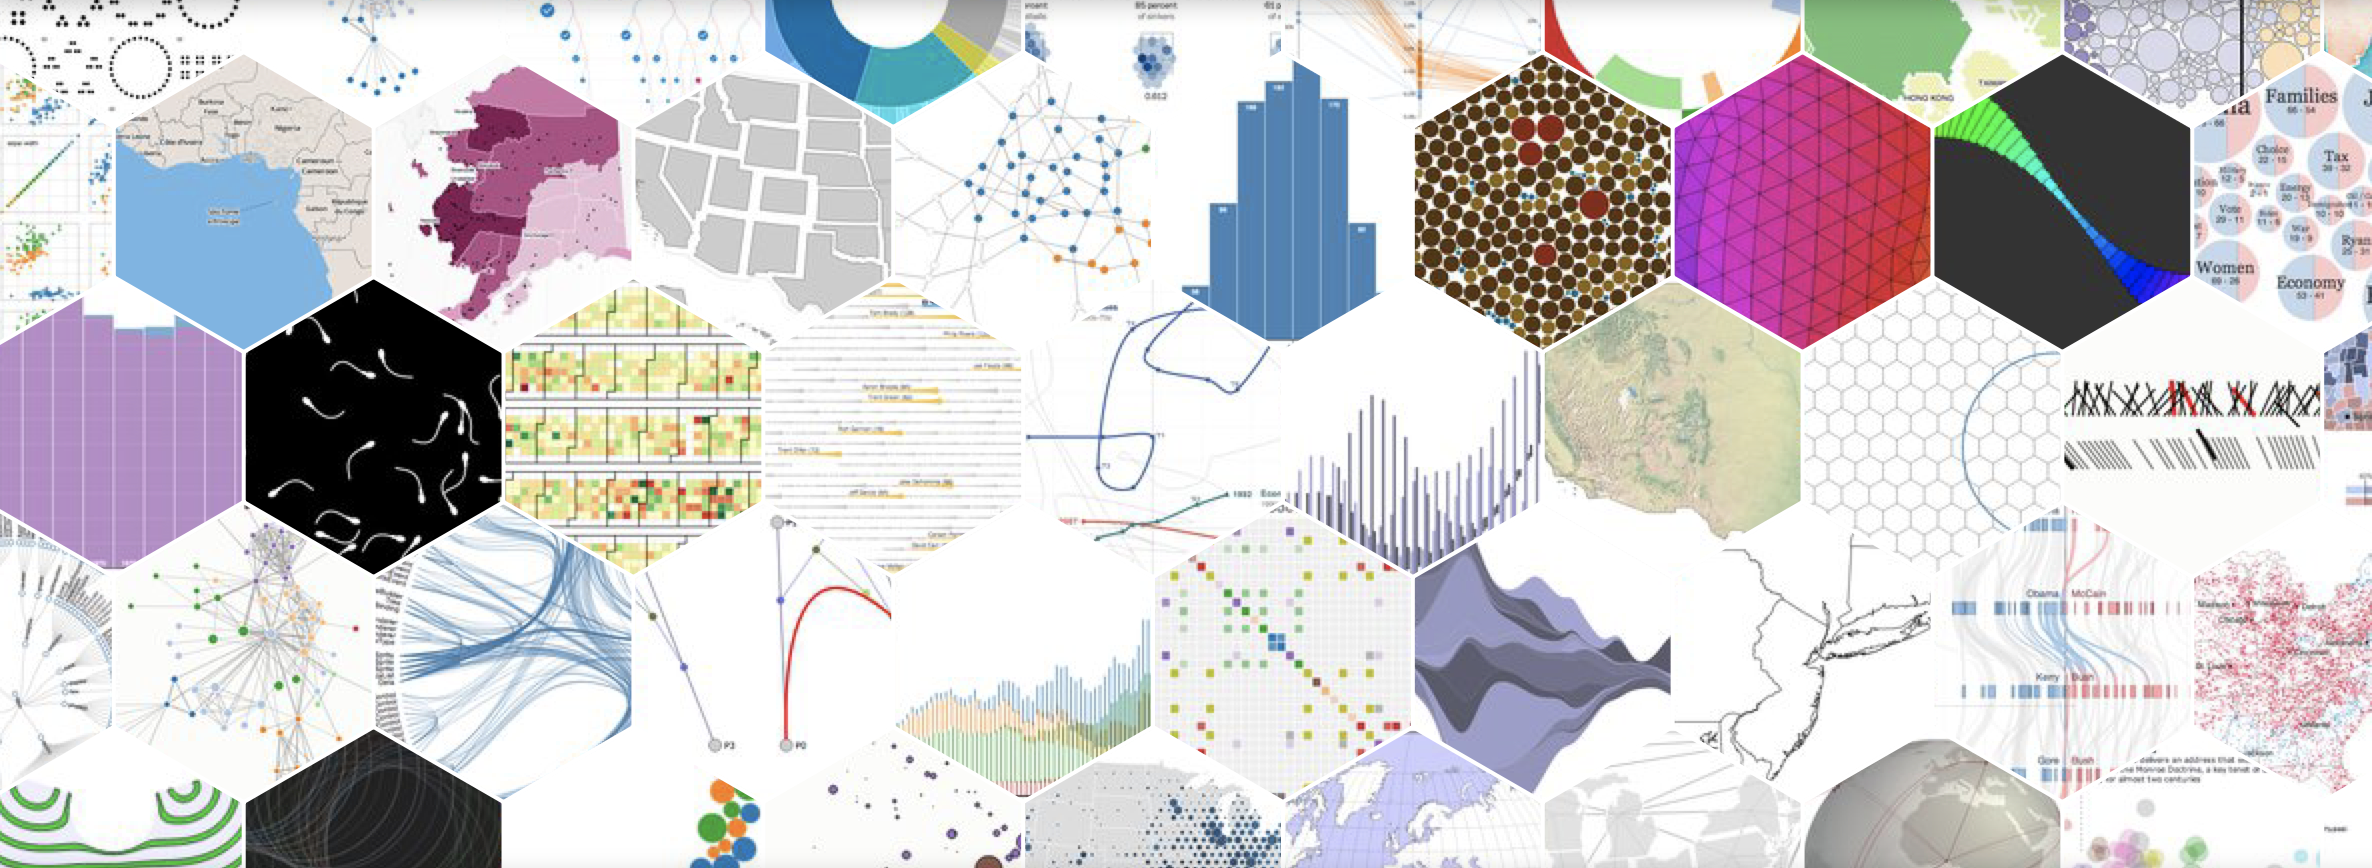
A key extension to undertaking data analysis is the effective communication of the subsequent results, helping interested parties understand clearly the analytical outcomes. The very act of visualising data can also itself play a key role in the interpretation and understanding of data. In this blog, we gather together and discuss a range of data […]

COVID-19 Hackathons – Winners announced for first and second events

We are pleased to be able to announce the winning teams for the first two events in the NERC COVID-19 Digital Sprint Hackathons – Air Quality and Recovery. We had some really fantastic entries to choose amongst and the judging panels had a hard job. But after much deliberation, the woinners to date are announced […]

COVID-19 Hackathons – Mid-point update

A big thank you to all the teams who have participated to date in our COVID-19 Hackathons – the events are proving popular. As of today we have now completed the first two events – ‘Air Quality‘ and ‘Recovery‘. The judging panel have met with respect to the first event and the winners have been […]

Google Earth Engine and NO2 levels – Sentinel 5P

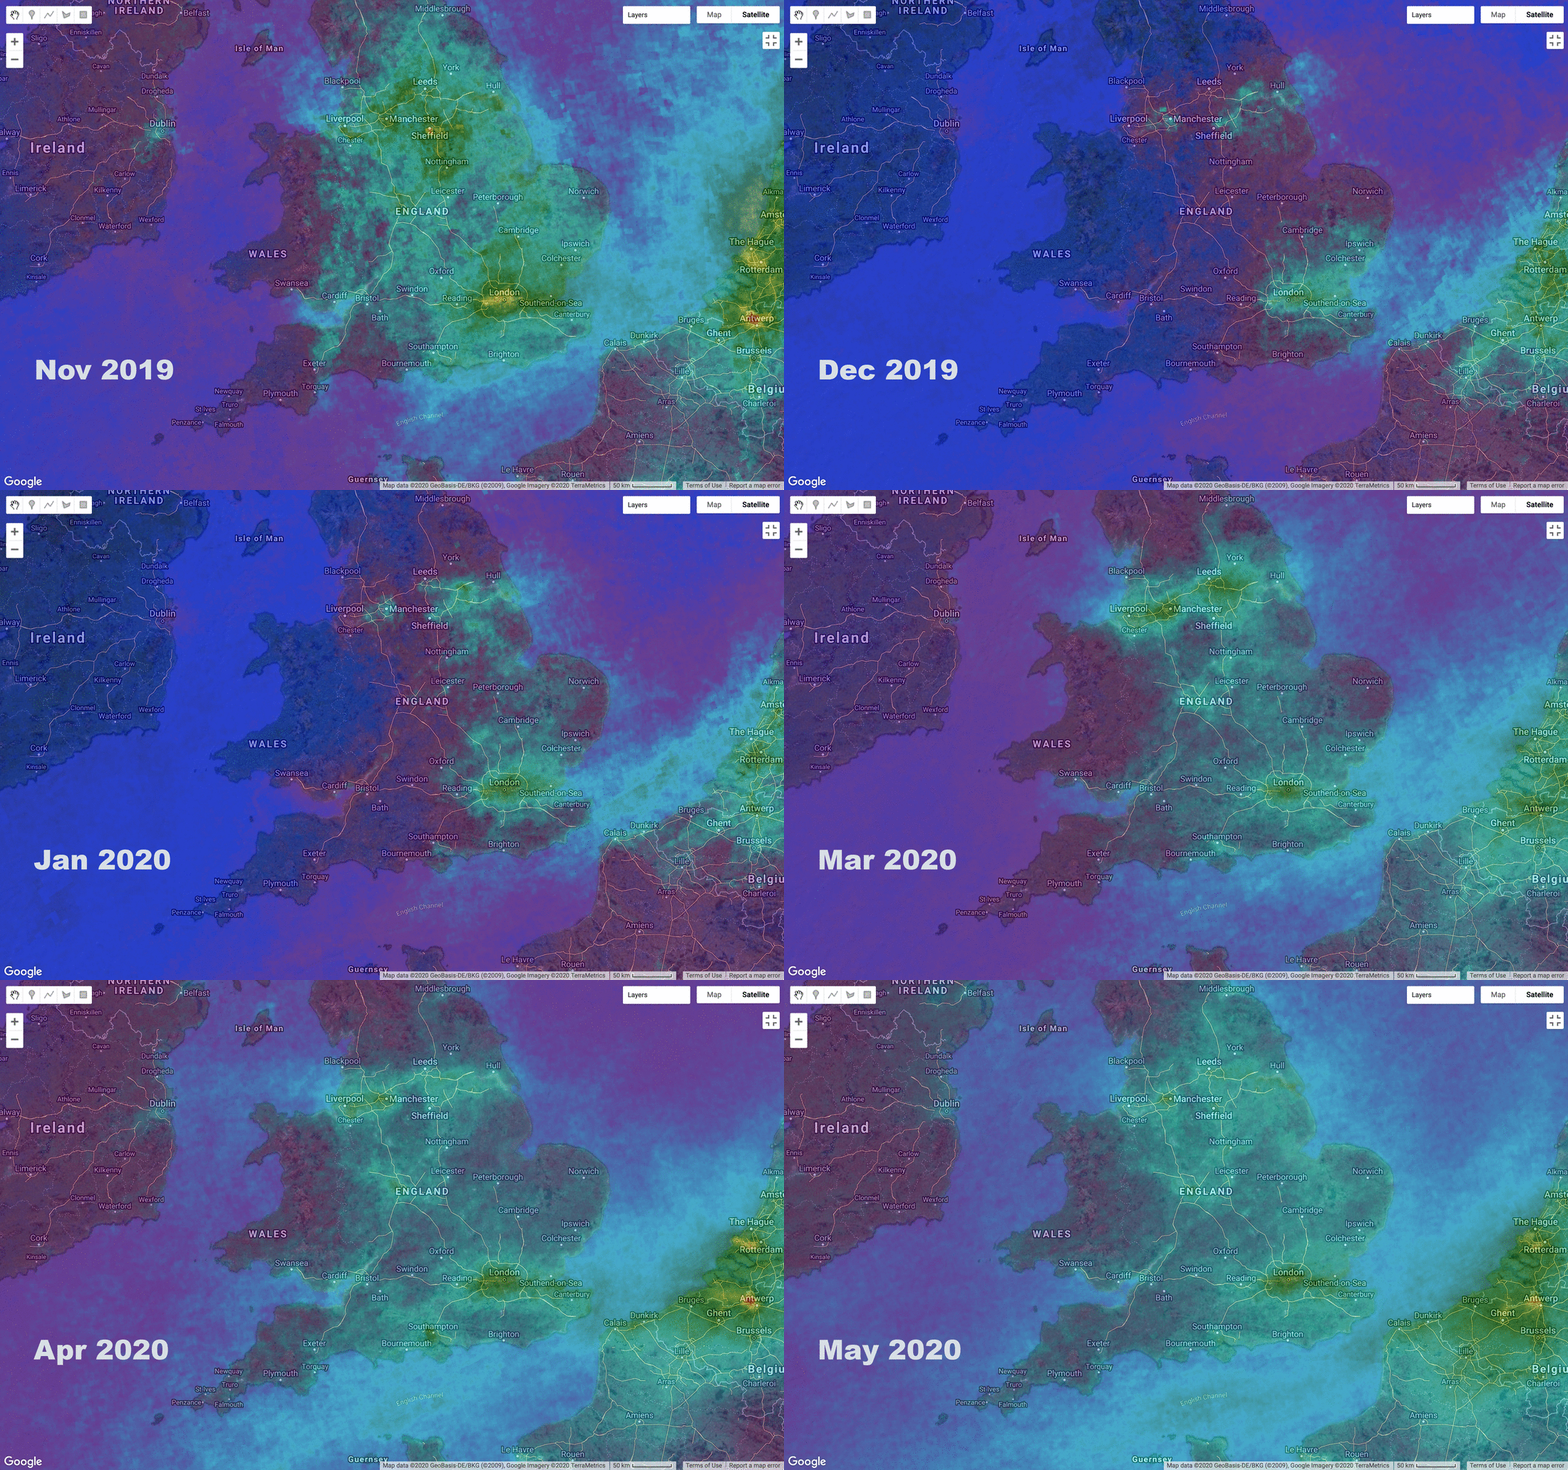
We wanted to experiment with the fantastic Google Earth Engine tool, which allows easy access to petabytes of satellite imagery, current and historic. We were interested to access the data from the Copernicus Mission Sentinel 5P satellite platform (which was launched in 2017) with a view to using its atmospheric monitoring capability to visualise the […]