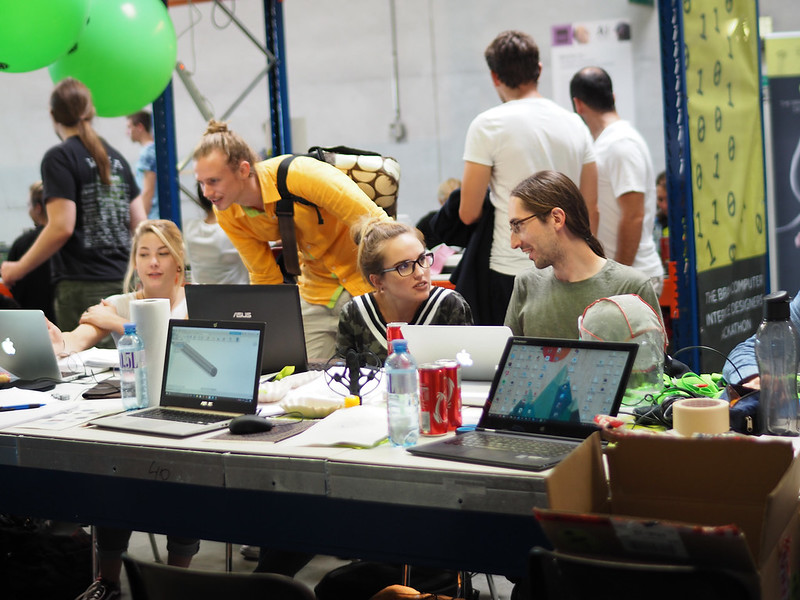
Image credit: Martin Hieslmair CC BY-NC-ND 2.0 https://flic.kr/p/XjqxLH
Bridging data sciences and the public with art
The hackathon is over and the winners have been announced on Devpost and here. We thank everyone for taking part! For reference, the details below have been retained as a record of the event.
We’re calling for environmental researchers, data and visualisation specialists to join a Natural Environment Research Council (NERC, part of UK Research and Innovation) – funded Hackathon in July 2022 that will run in parallel with the Constructing a Digital Environment Conference #CDE22. It will take place from Sunday 10th July to Tuesday 12th July at the University of Birmingham, but remote participation is also encouraged. Entrants will work together or individually to draw on digital data from NERC EDS, Copernicus and NASA to turn scientific data into art creations, in any format, to enhance the communications between scientists and the public.
The Awards
We are offering awards of up to £3000 for the best solutions to helping general public better understand our environment and sciences.
- First place award £3,000
- Second place award £1,500
- Third place award £500
Awards are made to the team, to be shared out amongst team members.
Guidance
In the Hackathon, we will provide delegates with access to data within the NERC Environmental Data Service. This data encapsulates a unique body of insightful knowledge describing environmental themes such as levels of atmospheric pollution, ecological impacts, soil and water quality. However, participants may use any alternative environmental dataset they can access. The participants are suggested to consider the following aspects in developing your artwork for communicating environmental science with the public:
Topic
• Social justice
• Hopeful futures
• Worst-case scenario
• Human-scale visions of risk
• From a child’s perspective
• Engaging with uncertainty
• High-tech future
• Ecotopia
• Time & temporality
• Desert planet
• Sustainability
• Human behaviour
• Climate change
• Environmental quality
• Conservation
Regional Scale
- UK city
- UK region
- UK
- Europe
- Any other continent
- Any other country
- Other geographical area
Temporal Scale
- century
- decade
- year
- season
- month
- week
- day
Data
- Temperature
- Rainfall
- Sea level
- Land cover
- Storm
- Disasters
- Water quality
- Biodiversity
- Socio-economic
- Infrastructure
- Transportation
- Migration
- Population
- Human footprints
- Elevation
Art Medium
- Painting
- Skit
- Sculpture
- Public art installation
- Immersive experience
- Interactive Website
- Poetry
- Short film
- Photography
- Performance art
- Music
- Stand-up comedy
- Poster
- Infographics
- Games
We encourage the formation of teams for entering the hackathon and encourage these teams to adopt a multi-disciplinary approach. Teams may be formed before the Hackathon starts, but this can happen during the brainstorming session, where people with the same or similar ideas will be grouped to form additional teams, or join existing ones
How will it work?
The Hackathon will run in parallel with the main #CDE22 events, participants will be required to register to attend #CDE22 (which is free of charge) for in-person or remote attendance. The Hackathon will share networking space, lunch and refreshments with the conference sessions – participants are encouraged to attend the oral and keynote sessions and embed the knowledge presented into the solution. The judging will take place on Tuesday afternoon (but may not be announced until later) and there will be opportunities to present briefly to the conference. In-person participants will get free snack food on Sunday and Monday evenings in additional to the free conference lunch and refreshments during the day on Monday and Tuesday.
Though digital environment data is your source information, the output is not necessary to be in digital format, and the creation of physical objects, artwork and prototypes will be considered equally with digital solutions.
Outline Timetable
The following specific blocks of time are suggested to allow participants to engage in the parallel conference. Participants may also access the Hackathon room during breaks and lunchtime and at the discretion of the room supervisor.
Sunday 10th July 2022
| 15:00 – 15:20 | Arrival and Hackathon Registration |
| 15:20 – 15:40 | Welcome and Challenge Briefing |
| 15:40 – 16:00 | Introduction to data accessibility. Meet the artists. |
| 16:00 – 17:00 | Brainstorming and Team Forming |
| 17:00 – late | Hackathon Session #1 |
| 20:00 | Food will be provided for in-person participants |
Monday 11th July
| 09:00 – 09:50 | Hackathon room available prior to conference start |
| 12:15 – 14:40 | Hackathon room opens at lunch break – Session #2 |
| 16:00 – 16:30 | Hackathon room available during refreshment break |
| 16:30 – 16:40 | Hackathon update to plenary session |
| 17:45 – late | Hackathon Session #3 – Low Fidelity Prototyping |
| 19:00 | Food will be provided for participants |
Tuesday 12th July
| 09:00 – 09:30 | Hackathon room available prior to conference start |
| 10:35 – 11:05 | Hackathon room available during refreshment break |
| 12:50 – 13:50 | Hackathon room opens at lunch break – Session #3 |
| 15:40 – 16:00 | Hackathon room available during refreshment break |
| 16:00 – 16:30 | Hackathon demos/presentations to conference attendees |
| 17:00 | Submission deadline |
How we will judge the Hackathon entries
The entries will be judged in by a combination a judging panel (appointed by NERC) who will view the output by demonstration or presentation. Arrangements will be notified to remote participants for how to submit their entry (via Devpost or GitHub for example). The judges decision will be announced within one week of the conference. The judging criteria will include:
- Information content (30%)
What environmental science subject do you want to communicate with the public? Why it is important to highlight on the particular issue? What datasets are used and why? What techniques do you use to analyse data to generate the information being utilised in your output? - Originality and Creativity (15%)
The novelty in the methodology of analysis and/or presentation. - Artistic merit (25%)
The quality and viability of artwork to effectively communicate environmental science with the public. - Technical implementation (20%)
The technical or technological skills required for the creation. - User experience (10%)
Easiness for users to understand and/or interact via the artwork.
Data
For suggestions of suitable data and sources, see this page: https://digitalenvironment.org/cde-22-hackathon/cde22-hackathon-data-sources/
Contacting Us
Please contact us with any questions on spfdigienv@cranfield.ac.uk