Embedded NERC Digital Researcher Dr Martin Wearing shares his thoughts on the research he is conducting.
In November 2021, I started a six-month placement at the satellite data company EarthWave, as part of NERC’s Embedded Digital Researcher programme. The aims of the placement are to build a digital infrastructure for viewing and accessing coincident satellite data, and to measure ice-sheet damage from satellite imagery using a neural network. In this blog post I’ll give an overview of the background to the project and a summary of the progress during the first few months.
Background
In my long-term position I am a Postdoctoral Research Associate in ice-sheet modelling at the University of Edinburgh. My research aims to improve our understanding of the dynamics of the Antarctic Ice Sheet and its future contribution to sea-level rise. Sea-level rise is a threat to low-lying coastal communities and infrastructure around the world, with projections suggesting that sea level may rise by up to 1 m by 2100 (Figure 1; IPCC AR6 WG1 2021). However, these projections are uncertain, with large uncertainties associated with the future contribution to sea level from the Antarctic Ice Sheet (Seroussi et al., 2020). I strive to improve ice-sheet models by utilising the ever increasing quantity and quality of remote-sensing observations of the polar regions, using innovative digital methods to enable a fusion between observations and numerical modelling.

My host organisation are EarthWave, an Edinburgh-based data science start-up specialising in earth observation. They use remote sensing, big data computing, and artificial intelligence to focus on understanding, predicting and preventing the effects of climate change. EarthWave are part of multiple Europe-wide consortia, delivering scientific research and processing algorithms using a wide range of satellite data and ground-based sensors for mapping ice trends, monitoring renewable energy systems, and making environmental data easily accessible and understandable. EarthWave produce elevation-change products for the European Space Agency (ESA), using the CryoSat-2 satellite and have led the development and implementation of the Cryo2Ice Coincident Observations Explorer, which pin points overlaps between the CryoSat-2 and ICESat-2 altimetry satellites.
The project aims to build upon the Cryo2Ice Explorer to incorporate coincident satellite imagery. The data portal will allow identification, processing and visualisation of coincident satellite data. This will eliminate the need to search through multiple datasets in order to identify satellite observations from a specific location at a specific time, and furthermore allow the data to be previewed prior to download. It will also allow the wider spatial context of changes to be easily investigated. This increase in the digital capacity of EarthWave will hopefully attract future clients. These capabilities will be demonstrated with a case study of the Amundsen Sea Sector of West Antarctica. This area of the Antarctic Ice Sheet is currently undergoing large change and has the potential to make a large contribution to sea level. It is also the focus of the $50 million NERC-NFS project the International Thwaites Glacier Collaboration.
To demonstrate the utility of conincident satellite altimetry and imagery we are developing a neural network to quantify ice-sheet damage from satellite imagery. Ice damage is the term used by glaciologists to describe the reduction in structural integrity of ice due to fractures and crevasses. The aim of this aspect of the work is to generate a time-series of ice-sheet damage to be used to track the evolution of ice damage and to validate a physics-based law for damage evolution, which could be implemented into ice-sheet models used for future sea-level projections. At present the creation and evolution of ice-sheet damage is not included in ice-sheet models, but is important because increased damage leads to increases in ice flow speed.
Progress so far
I have been warmly welcomed in to EarthWave. I participate in the day-to-day activities of the company, including project updates from other team members and I have been encouraged to make contributions to the development of other projects. I have also presented a summary of ongoing work and pitched future research ideas to ESA on behalf of EarthWave.
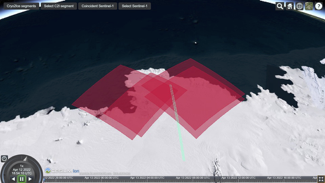
We have made good progress with the development of the coincident data portal. Building upon the existing Cryo2Ice digital infrastructure, we have developed a prototype data-explorer in a python notebook, which integrates with the current system. An initial prototype of the user web interface has been produced (Figure 2) giving an insight into how the final product may look and operate. One outstanding issue is the ability to project a preview of the satellite image onto the interactive map. At present we are limited to a pop-up preview of the image, but we are hopeful a solution to this can be found.

Initial development of the neural network is ongoing. We are using the deep convolution neural network UNet, which has previously been used to classify ice fractures from satellite imagery (Figure 3; Lai et al., (including Wearing) 2020). However, here we are using higher-resolution imagery (50m vs 250m) and will analyse a time series of imagery, quantifying the level of damage rather than a binary classification (fracture or no-fracture). We are using ice-sheet model results from the ITGC project as training data for the neural network (Figure 3). We are hopefully that we will continue to make progress with this in the next few months. Stay tuned!

References
IPCC, 2021: Summary for Policymakers. In: Climate Change 2021: The Physical Science Basis. Contribution of Working Group I to the Sixth Assessment Report of the Intergovernmental Panel on Climate Change [MassonDelmotte, V., P. Zhai, A. Pirani, S.L. Connors, C. Péan, S. Berger, N. Caud, Y. Chen, L. Goldfarb, M.I. Gomis, M. Huang, K. Leitzell, E. Lonnoy, J.B.R. Matthews, T.K. Maycock, T. Waterfield, O. Yelekçi, R. Yu, and B. Zhou (eds.)]. Cambridge University Press. In Press.
Seroussi, H., Nowicki, S., Payne, A. J., Goelzer, H., Lipscomb, W. H., Abe-Ouchi, A., Agosta, C., Albrecht, T., Asay-Davis, X., Barthel, A., Calov, R., Cullather, R., Dumas, C., Galton-Fenzi, B. K., Gladstone, R., Golledge, N. R., Gregory, J. M., Greve, R., Hattermann, T., … Zwinger, T. (2020). ISMIP6 Antarctica: a multi-model ensemble of the Antarctic ice sheet evolution over the 21st century. The Cryosphere, 14(9), 3033–3070. https://doi.org/10.5194/tc-14-3033-2020
Lai, C.-Y., Kingslake, J., Wearing, M. G., Chen, P.-H. C., Gentine, P., Li, H., Spergel, J. J., & van Wessem, J. M. (2020). Vulnerability of Antarctica’s ice shelves to meltwater-driven fracture. Nature, 584(7822), 574–578. https://doi.org/10.1038/s41586-020-2627-8